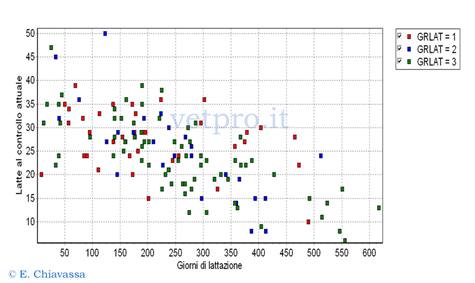
To increase our specific expertise regarding the farms we manage, it can be very useful to compare production data divided by lactation groups (primiparous in red, secondiparous in blue, multiparous in green).
Please note that data processing and analysis must always be accompanied by a careful clinical investigation of the farm to fully understand and correlate effects with causes.
This graph shows the lactation curves and peaks divided by lactation groups and represents the optimal situation of a farm (Soc. agr. A) with high milk production:
- the peak for multiparous cows generally occurs at about 8 weeks post-calving and persists for only one milk test.
- the peak for primiparous cows is generally later (14 weeks) and has a less pronounced curve.
An optimal trend of the curves can be observed, as well as an optimal ratio between the peaks of the different groups, as highlighted by the objectives included in the graph.
The level of the peaks is high, considering that every additional kg of milk at the peak will correspond to approximately 280 kg more milk at 305 days of lactation for primiparous cows and 390 kg more for secondiparous cows.
Furthermore, in an optimal situation, the 2nd milk test after calving should be 105-107% compared to the first test.
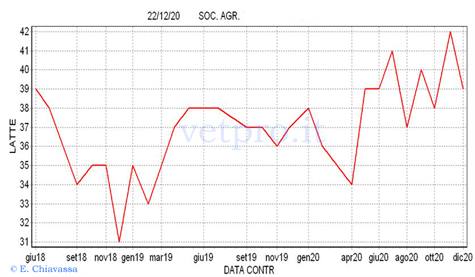
The graphs presented in this sequence of images are derived from the processing of farm data using Dairy Comp 305 software.