Sooner or later in the course of our work, we will be asked: "Why do my cows produce so little milk?" At that point, we need to be able to respond professionally, using an analytical approach through a static and dynamic analysis of milk production.
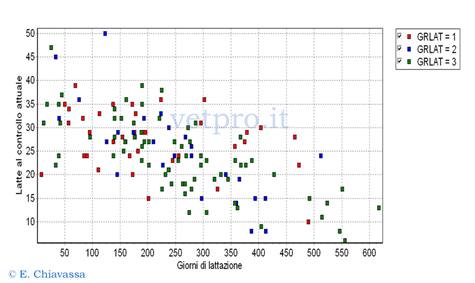
Let's start with the static analysis: this graph is a "snapshot" of the milk production of each individual lactating cow in the herd at a given moment (the day of the test), in relation to days in milk.
First-lactation cows are shown in red, second-lactation cows in blue, and cows with > more than 2 lactations in green.
Thanks to this graph, it is possible to assess the herd's productivity level at that moment and highlight its limitations, identifying critical areas (see the following image).
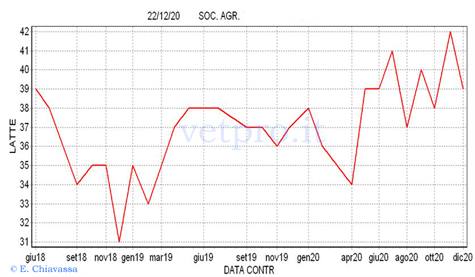
The graphs presented in this sequence of images are derived from the processing of herd data using Dairy Comp 305 software.